This article will guide you through understanding how to read email reports and analytics.
Accessing Email Reports and Analytics
1. Login to your Member365 Administrator Dashboard.
2. On the top bar, click ‘Email Campaigns‘.
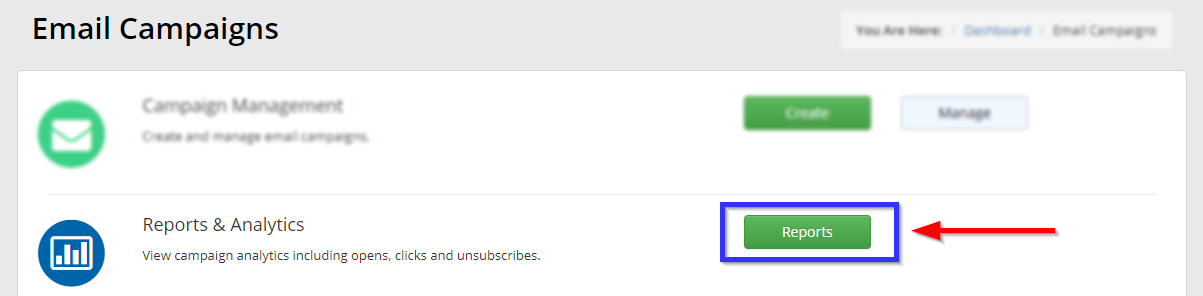
3. Next to ‘Reports & Analytics’, click ‘Reports‘.
Reports and Analytics
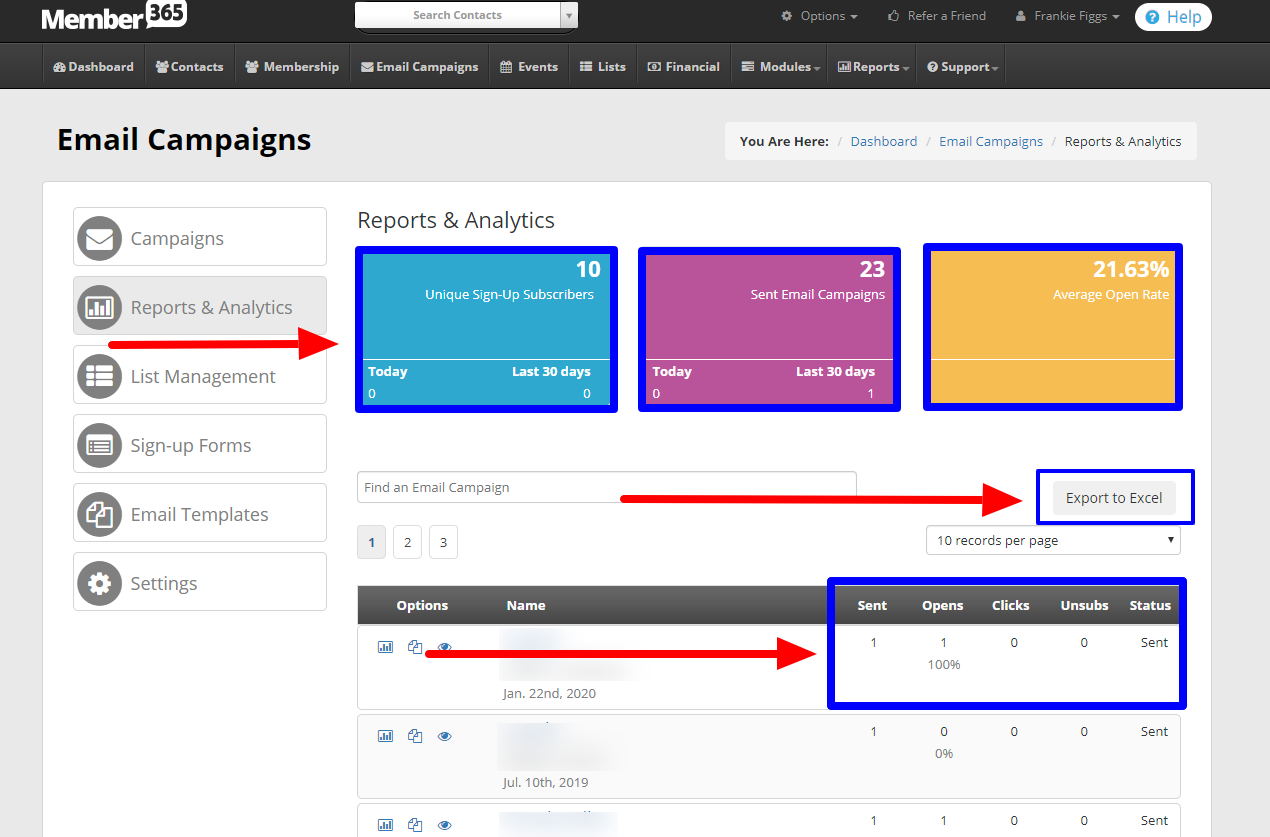
The home page of the Reports and Analytics section shows you general data about email success rates, and in the list below that you can see statistics for each individual campaign. You can also export all statistics to an Excel Document for an overview of all your campaign analytics.
General Statistics
Unique Sign-Up Subscribers: How many unique email addresses have been added by people choosing to subscribe to your mailing list.
Sent Email Campaigns: The number of email campaigns you have sent out.
Average Open Rate: The frequency with which users who receive your emails click to open them: if you have sent out one hundred emails across any number of email campaigns, and five of them have been opened, you will see a figure of 5% here.
Export to Excel
Export an overview of all your campaign analytics for comparison and reporting.
Campaign-Specific Statistics
Sent: How many copies of this campaign were sent.
Opens: The number, represented as both a count and a percentage, of times that an email was opened.
Clicks: The number of users who opened an email and clicked a button or link within it. To improve this figure, see our Knowledge Base article on increasing click rates.
Unsubs: The number of users who used the link in an email campaign to unsubscribe from the mailing list.
Viewing Campaign Statistics
To view the statistics for an individual campaign, click on its name in the list. You will arrive at a more details analytics report; the first page is the ‘Unique Opens‘ breakdown.
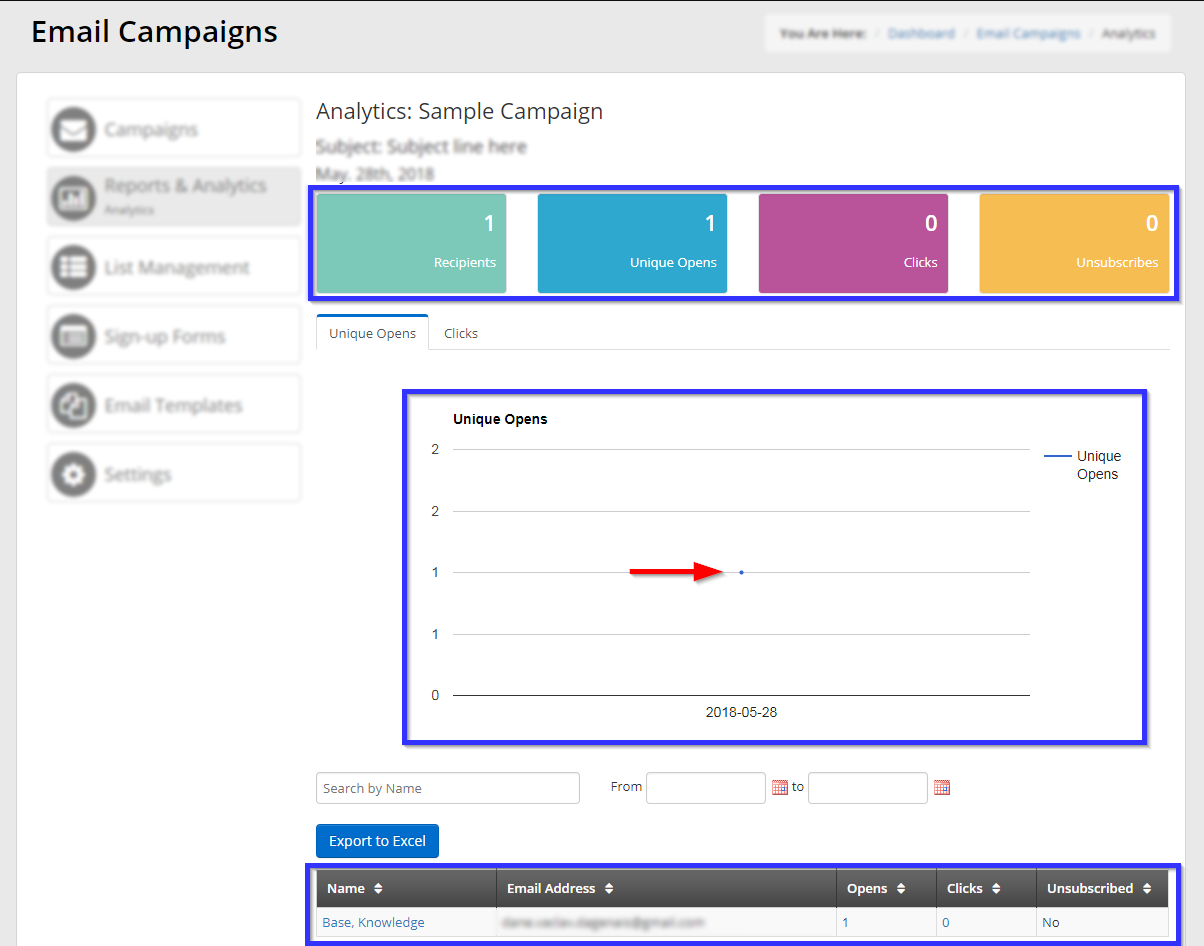
The four statistics at the top are the same ones displayed in the list in the previous page. Below is a graph showing unique opens over time — in this case, the one open was the single point indicated by the red arrow. Further down is a list of those of who have opened the email, including their name, email address, the number of times they opened the email, the number of times they clicked elements or links in the email, and whether they responded to the email by unsubscribing.
Next, click on ‘Clicks‘ to see the other half of the analysis.
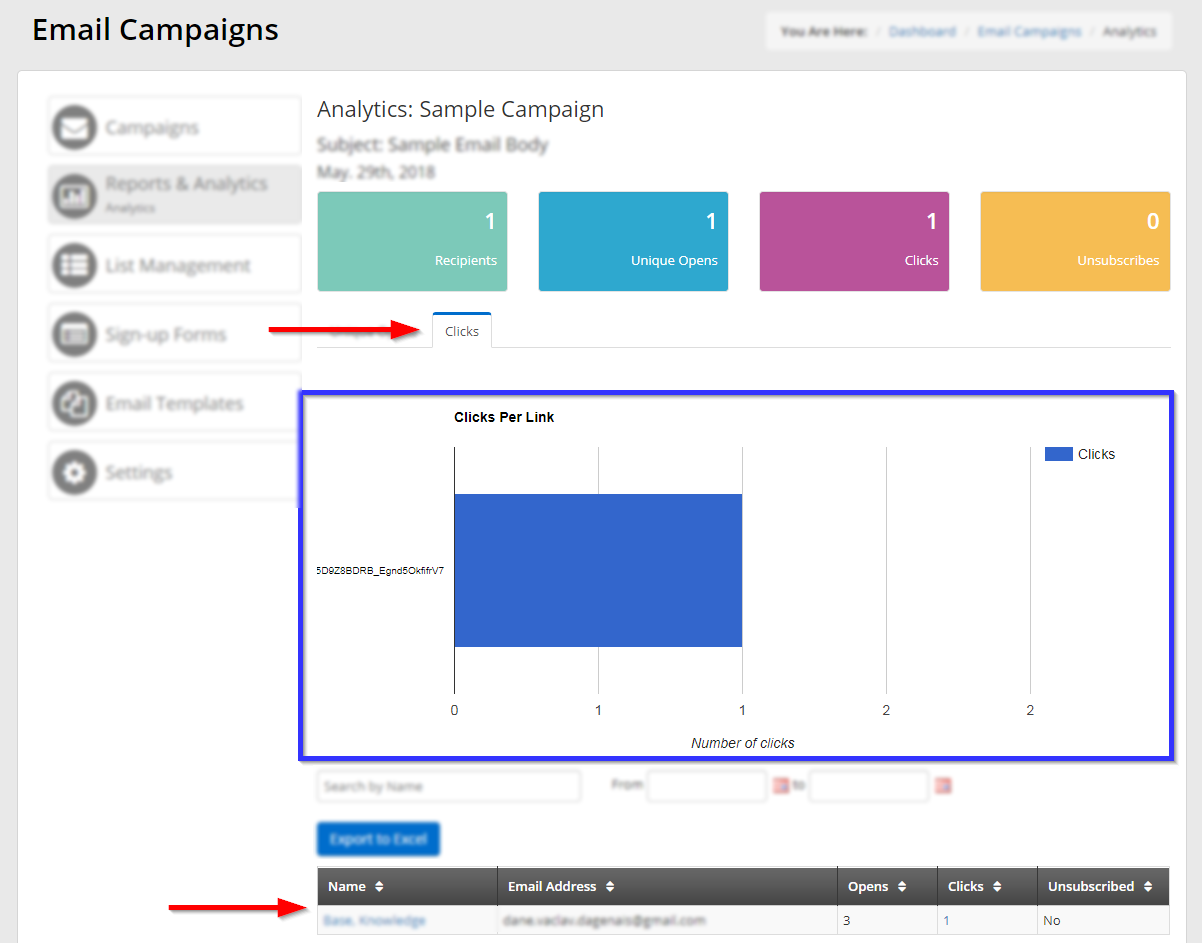
This page shows you the number of clicks on each link in your email: in this graph, the blue bar refers to the end of the URL seen on the left side of the chart; additional links would appear above and below it in this graph. The list at the bottom contains the same information as the list in the previous page.
Congratulations, you now know your way around your campaign analytics and statistics!