Member365 measures the Engagement Analytics of your Members through actions such as Logging into the Member Portal, opening Email Campaigns and registering for Events.
Do you want to track the engagement of your Contacts, or even view a breakdown of who performed what action when? This article will show you how to do so!
Accessing Engagement Analytics
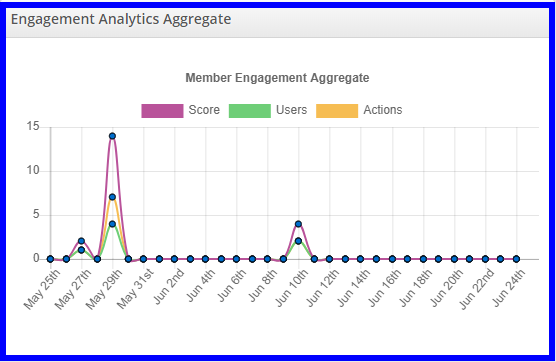
The Engagement Analytics are easy to find in Member365! Log into your Administrator Dashboard, scroll down, and click anywhere on the ‘Engagement Analytics Aggregate’ graph.
View Member Engagement
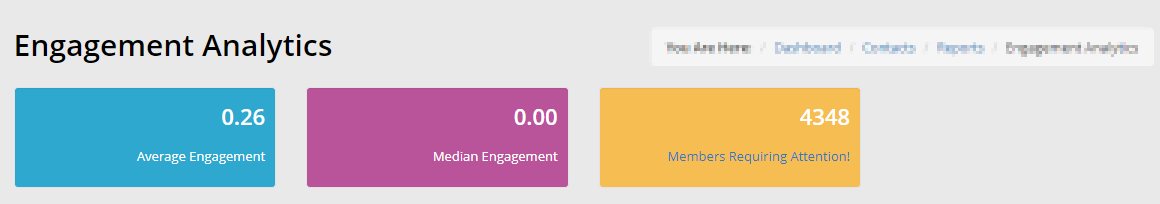
Upon clicking the Engagement Analytics Aggregate from the dashboard, you will reach the page for all Member Engagement reporting and analytics!
Engagement Statistics
The Engagement Analytics will first show the general engagement statistics.
When a Contact performs an ‘Action’ in your system – anything from logging in to registering for an Event – they earn ‘Engagement Points’. The Engagement Points of all your Contacts are collected and compared, to display as statistics when viewing your Analytics.
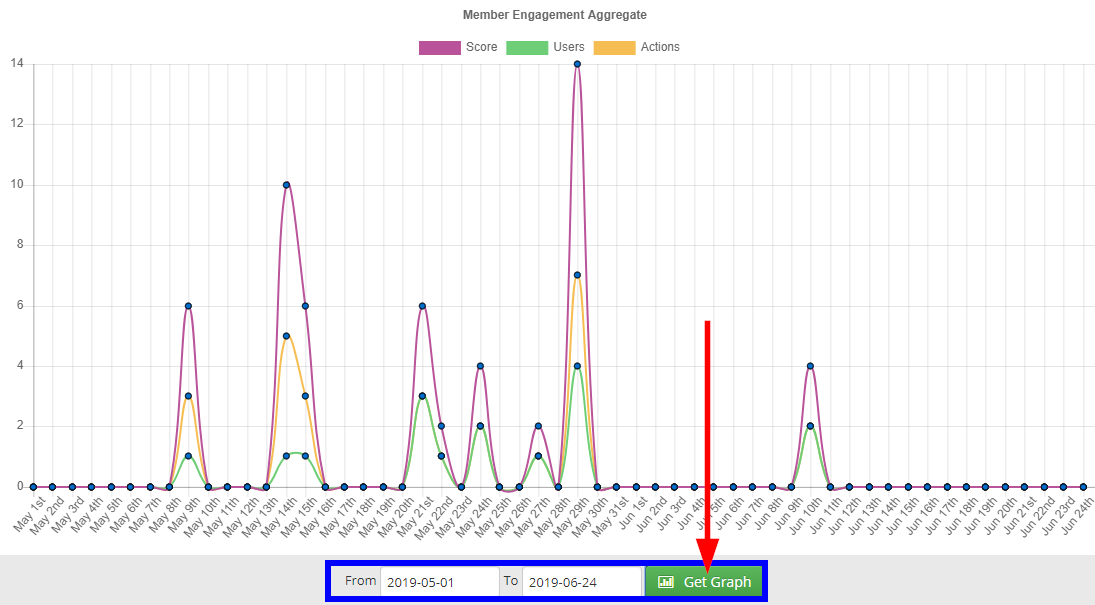
Specify the date range for your Engagement Analytics report by setting the From and To fields. Upon clicking ‘Get Graph’, your Engagement Analytics will update to display data from within the range you’ve selected.
Analytics
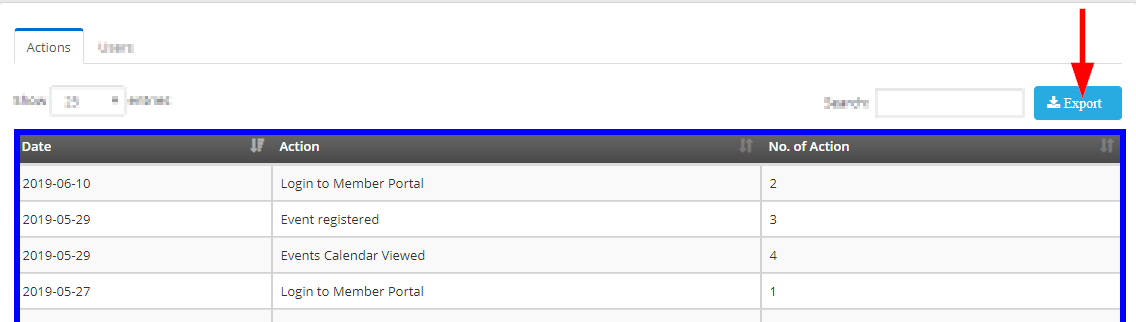
The first tab – titled ‘Actions’ – will show the analytics of each Action in your system within the date range that you’ve selected. You can click ‘Export’ to download a report of this data to Excel.
User Engagement
The ‘Users’ tab will list the Engagement Score of every Contact in your system within the time-frame that you have selected! Click the ‘Export’ button to download this list as an Excel file.
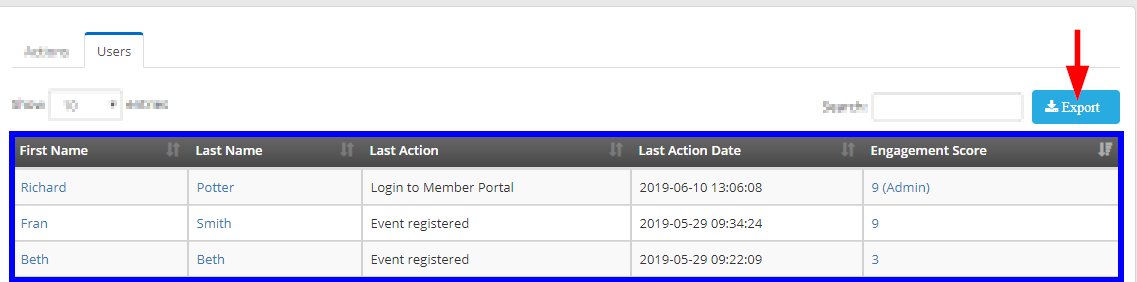
The Last Action of each Contact will be listed, as will the date of their Last Action. Click on the Contact’s Engagement Score to view their individual Engagement History.
Congratulations, you now know how to view and analyze your Member Portals Engagement Analytics!